Categories
Technical

Security in Power BI

Introduction to Data Security in Power BI

In the modern business environment, data security and compliance are paramount, protecting sensitive information from breaches and ensuring adherence to various legal regulations.

Microsoft Power BI is a versatile tool used by organizations to handle sensitive business data, necessitating robust security features to maintain integrity and privacy.

The objective of this blog post is to explore the various security features and compliance measures in Power BI, providing readers with insights into how to safeguard their data effectively within this platform.

Data Privacy Measures in Power BI

Power BI’s data encryption methods secure information both in transit and at rest, ensuring that data remains protected as it’s transferred and stored.

Data masking and privacy settings within Power BI are essential tools, allowing organizations to protect sensitive information without restricting access to essential data insights.

The use of Power BI’s Privacy Level feature enables customization for different data sources, providing flexibility in controlling data accessibility while maintaining privacy requirements.

User Authentication and Access Control

Power BI supports various authentication methods, such as OAuth2 and Multi-Factor Authentication, to verify user identities and provide secure access to data.

Role-based access control (RBAC) in Power BI ensures that users have access only to the information they are authorized to view, thereby maintaining both security and data integrity.

Audit logs within Power BI are instrumental in tracking user activities within the platform, offering an essential tool for monitoring and ensuring compliance with security policies.

Compliance with Various Regulations (e.g., GDPR, HIPAA)

Power BI aligns with various regional and industry-specific compliance standards, ensuring that data handling meets the necessary legal and ethical guidelines across different markets.

Power BI includes specific features and processes, such as data encryption and privacy controls, that enable compliance with key regulations like GDPR and HIPAA, enhancing trust and security.

The platform allows users to customize Power BI settings, enabling them to tailor data management and reporting practices to meet specific regulatory requirements unique to their industry or region.

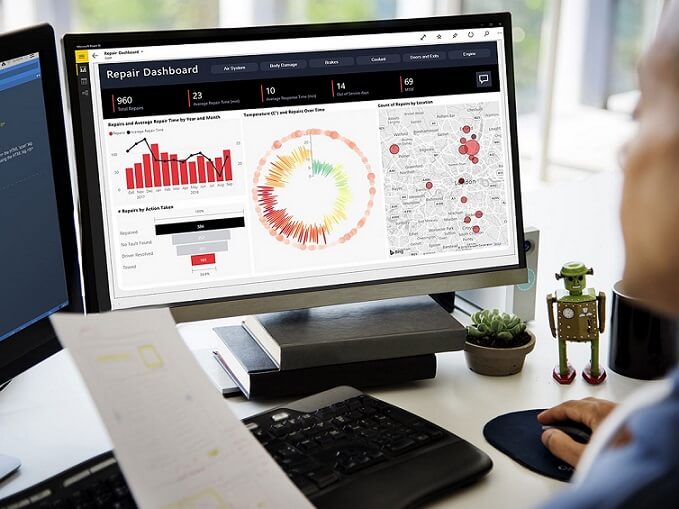
Monitoring and Reporting Tools

Power BI’s monitoring capabilities include security alerts and dashboards, enabling real-time tracking of potential threats and providing an overview of the system’s security status.

Power BI integrates seamlessly with tools like Azure Security Center, offering a more comprehensive security overview by combining insights and analytics across platforms.

Setting up and utilizing Power BI’s reporting tools for security compliance empowers organizations to maintain rigorous standards, with custom reports and alerts that align with specific security needs and regulations.

Conclusion and Best Practices

Power BI’s approach to data security and compliance emphasizes robust encryption, authentication, and alignment with global regulations, providing a secure platform for business analytics.

By offering best practices and tips, organizations can leverage Power BI’s features effectively to maintain data integrity and adhere to specific industry compliance standards.

Staying informed about updates and changes to Power BI’s security features and compliance standards is vital for continuous protection, and this comprehensive guide serves as a valuable resource for understanding these critical aspects.

Categories
Technical

Python with Power BI

Power BI’s integration with Python opens up a wide array of analytical and visual possibilities, leveraging powerful libraries and functions. Here’s how the integration works and what it can offer:

1. Setting Up Python in Power BI

  • Installation: Power BI supports various Python distributions. Anaconda is commonly used as it includes many of the necessary data science packages.
  • Configuration: In Power BI Desktop, you can set up the Python scripting option by selecting the Python distribution installed on your machine.

2. Utilizing Python Scripts in Power BI

  • Query Editor: You can run Python scripts to transform data within the Power Query Editor. This allows for data cleaning, transformation, and feature engineering using Python code.

https://learn.microsoft.com/en-us/power-bi/connect-data/desktop-python-scripts

  • Python Visual: Power BI provides the ability to create visuals using Python libraries like Matplotlib, Seaborn, and Plotly. This expands the range of visualization options within Power BI.

https://learn.microsoft.com/en-us/power-bi/connect-data/desktop-python-visuals

3. Advanced Data Analytics

  • Machine Learning Models: You can build and train machine learning models using Python libraries like Scikit-learn and then use them within Power BI for predictions.
  • Statistical Analysis: Conduct complex statistical analysis using libraries like Statsmodels to bring deeper insights into Power BI reports.

https://learn.microsoft.com/en-us/power-bi/connect-data/service-tutorial-build-machine-learning-model

4. Use Cases and Benefits

  • Custom Visualizations: Create entirely customized and interactive visuals not available in the standard Power BI visual library.
  • Data Preprocessing: Utilize Python’s powerful data manipulation libraries like Pandas for sophisticated data transformation.
  • Predictive Analytics: As mentioned earlier, Python integration allows for the development of predictive models, such as regression, classification, clustering, etc.

5. Challenges and Considerations

  • Performance: Python scripts can add processing time to Power BI reports, so careful consideration should be given to script complexity and data volume.
  • Security: Ensuring that the Python code used complies with organizational security guidelines.
  • Version Compatibility: Ensuring that the Python libraries and versions used are compatible with each other and with Power BI.

Summary

Power BI’s integration with Python significantly enhances its capabilities, enabling more advanced analytics, data transformations, and custom visualizations.

It opens the door for data scientists and analysts to bring their Python expertise into Power BI environments, bridging the gap between data analysis and business intelligence.

For Power BI courses visit our site

Categories
Technical

5 Ways to Improve Power BI performance

1. Optimize Data Model and Queries:

One way to enhance Power BI’s efficiency is to reduce the amount of unnecessary data. This can be achieved by filtering out irrelevant columns and rows, focusing only on the information that is crucial for analysis. By limiting the data processed, you can make queries more responsive.

In addition to data reduction, it’s also beneficial to use summarized tables where possible. This condensation of information makes handling large datasets more manageable and improves performance.

Optimization guide from Microsoft

2. Leverage Proper Indexing and Relationships:

Proper indexing and well-defined relationships within the data model are essential components in optimizing Power BI performance. By utilizing the right indexing techniques, you can significantly speed up queries, making data retrieval more efficient.

Correctly defining the relationships between tables is equally important. Ensuring that the tables are interconnected correctly allows Power BI to join data efficiently. This precise joining of data enables faster insights and contributes to a smoother, more effective data analysis process.

Data Modeling from Microsoft

3. Choose the Right Storage Mode:

Deciding between Import or DirectQuery mode is a crucial consideration when working with Power BI, and the choice should be based on the specific requirements of the report. Different scenarios may necessitate different approaches, and understanding the nature of the data and the needs of the report is vital in making this decision.

Import mode is often preferred when faster performance is needed for reports, as it allows data to be stored within Power BI itself. By storing a snapshot of the data, Import mode can provide quicker access and rendering, making it a suitable choice for many reporting situations.

Data Storage from Microsoft

4. Utilize Efficient Visualizations:

Efficient use of visualizations is key to enhancing the user experience in Power BI. Selecting the appropriate visuals that render quickly and align with your specific needs ensures that your reports are not only insightful but also responsive.

Being mindful of the number of visuals on one page is also essential. Overloading a single page can lead to slow loading times and a cluttered appearance. Instead, it’s advisable to distribute them across tabs or employ drill-through features. This approach maintains an organized layout and allows users to navigate the report more effortlessly.

Visualizations in Power BI

5. Monitor and Analyze Performance:

Utilizing Power BI’s Performance Analyzer tool allows you to identify bottlenecks and understand the performance of each element within your report. This in-depth insight helps in pinpointing areas that might be slowing down the report and allows for targeted improvements.

An ongoing process of regular review and update of the report is equally important. By constantly analyzing the performance insights, you can make necessary adjustments to the queries and visuals, optimizing them to ensure that your reports run smoothly.

The Performance Analyzer from Microsoft

For Power BI Course information please contact us.

Categories
Career

10 Interview Questions & Answers for Power BI

Question 1:
Can you explain what Power BI is and how it’s commonly used in a business context?

Answer:

Power BI is a data visualization and business intelligence tool developed by Microsoft.
It enables users to connect to a variety of data sources, transform the data, and create interactive dashboards and reports.
Power BI supports real-time insights, allowing businesses to make data-driven decisions.
It promotes collaboration among team members by providing sharing and publishing capabilities.
Common uses include tracking KPIs, analyzing trends, and providing actionable insights to stakeholders.

Question 2:
How would you approach designing a dashboard for a client who wants to monitor sales performance across different regions?

Answer:

Identify the client’s key metrics, KPIs, and specific requirements for tracking sales.
Connect to the relevant data sources that contain sales data for the regions.
Use Power BI’s data modeling and transformation tools to shape the data as needed.
Design a dashboard layout with visuals like charts and maps to represent sales data across regions.
Ensure the dashboard is interactive, allowing users to filter or drill down into more specific details.

Question 3:
What is DAX, and how is it used in Power BI?

Answer:

DAX (Data Analysis Expressions) is a formula language in Power BI.
It is used to create custom calculations for tables, columns, and measures within Power BI models.
DAX enables complex aggregations and calculations, enhancing data analysis.
It works in conjunction with Power BI’s visualization tools to create insightful reports.
DAX formulas can make use of a variety of functions, operators, and constants to perform data analysis.

Question 4:
Can you explain the difference between DirectQuery and Import modes in Power BI, and when you might use each?

Answer:

DirectQuery mode queries the data directly from the source and reflects changes in real time.
Import mode retrieves the data from the source and stores a snapshot in Power BI, reducing the load on the data source.
DirectQuery is ideal for large datasets and when real-time data is crucial, but it might affect performance due to constant querying.
Import mode provides faster report performance, as data is stored within Power BI, but it may require periodic refreshes.
The choice between the two depends on factors like data size, update frequency, and performance requirements.

Question 5:
How do you ensure that the right people have access to the right data within Power BI?

Answer:

Implement role-based security measures within Power BI, defining different access levels.
Use Power BI’s Row-Level Security (RLS) to restrict data access at the row level, based on user roles.
Share reports and dashboards only with authorized users or groups, using Power BI’s sharing and collaboration features.
Regularly review and audit access controls and permissions to ensure ongoing compliance.
Collaborate with IT and other departments to align data security measures with organizational policies.

Question 6:
Describe a situation where you used Power BI to solve a particular business problem. What was the problem, and how did you address it?

Answer:

The problem was identifying the cause of declining sales in specific product categories.
Connected to various data sources to gather sales, inventory, and marketing data.
Used Power BI to model and visualize the data, uncovering trends and correlations.
Identified that certain products were under-promoted, while others had inventory issues.
Presented insights to the management team through Power BI reports, leading to targeted marketing strategies and improved inventory management.

Question 7:
What are the key considerations when visualizing data for different audiences, such as executives vs. technical teams, in Power BI?

Answer:

Understand the specific needs and expertise of the audience; executives might prefer high-level overviews, while technical teams may need detailed analysis.
Choose the appropriate visuals; charts and graphs for executives and more granular data representations for technical teams.
Ensure clarity by using clear labels, legends, and tooltips tailored to the audience’s understanding.
Enable interactivity as needed, allowing deeper exploration for those who require it.
Maintain consistency and accuracy in the data presented, regardless of the audience.

Question 8:
How do you handle situations where the data source is unreliable or contains missing or inconsistent data?

Answer:

Utilize Power BI’s data transformation and cleaning tools to identify and rectify inconsistencies.
Work closely with data owners or database administrators to ensure data quality at the source.
Implement data validation checks within Power BI to catch potential errors.
If data is missing, decide whether to exclude it, fill it with a default value, or use statistical methods to impute it.
Document the handling of unreliable data to maintain transparency in the reporting process.

Question 9:
How do you keep up with the latest updates and features in Power BI, and how have you applied a recent update to enhance your work?

Answer:

Regularly follow Microsoft’s official Power BI blog, community forums, and other industry resources for updates.
Participate in training sessions, webinars, or conferences to learn about new features and best practices.
Test new features in a controlled environment before applying them to production reports.
Recently, used the latest Power BI update to implement a new type of visualization, enhancing the user experience and insight delivery.
Collaborate with peers and engage with the Power BI community to exchange ideas and knowledge.

Question 10:
Describe your approach to collaborating with stakeholders, such as business users or developers, in the process of creating a Power BI report or dashboard.

Answer:

Initiate the project with clear communication and understanding of the stakeholders’ requirements and expectations.
Regularly update stakeholders on progress, solicit feedback, and make adjustments as needed.
Collaborate with developers and other technical team members to ensure seamless integration with data sources and alignment with technical standards.
Provide training or documentation as needed to help business users understand and interact with the report or dashboard.
Foster a collaborative environment where all parties feel engaged and their inputs are valued.

For any Power BI training related questions please contact us.

Categories
Industry Trends

Power BI is Beating Tableau

Main Causes:

  • Salesforce is laying off staff.
  • Tableau’s transitioning from a standalone app to a Salesforce “integration”.
  • Microsoft Teams is outpacing Slack.
  • ChatGPT has been incorporated into Power BI.
  • Microsoft is aggressively pursuing the BI market

Salesforce is laying off staff

Salesforce, after acquiring Tableau in 2019, is now significantly reducing the staff that was part of the deal. Bloomberg reported that the job cuts at Tableau were proportionally greater than the rest of the company, signaling that the $15.7 billion acquisition has not met expectations.

The consequences are clear, with fewer people working on Tableau, there’ll be less innovation and updates.

This graphic shows Salesforces shifting priorities, with the executive teams mentions of “Tableau” at corporate events almost zero.

Tableau’s transitioning from a standalone app to a Salesforce “integration”

Tableau is transitioning from a standalone App to a visualization tool baked into the Salesforce suite, as highlighted by CEO Marc Benioff.

Since the acquisition, Tableau’s sales growth has lagged behind the rest of the company, and greater integration seems inevitable, according to Bloomberg and TechMonitor.

While this may benefit Salesforce users, it could diminish Tableau’s status as an independent product and might not appeal to others.

Additionally, Salesforce’s main CRM product faces fierce competition from companies like HubSpot, so integrating Tableau into a product already losing market share is not good.

Microsoft Teams is outpacing Slack

Introduced in 2017, “Teams” was relatively unknown to many just a few years ago. Now, it’s everywhere, with “Teams” meetings becoming a regular occurrence. Its swift ascent likely surprised even the most optimistic Microsoft executives.

While some businesses continue to use Skype (Seriously), the indication is that Microsoft will gradually transition them all to Teams.

Teams is outpacing Slack, as shown below.

The increasing adoption of MS Teams correlates with a decline in market share for Slack. Since Slack is owned by Salesforce, this trend also means more users are being funneled from Tableau into Power BI.

ChatGPT has been incorporated into Power BI

Microsoft, a major investor in OpenAI the creator of ChatGPT, is integrating ChatGPT into Power BI as part of their exclusive partnership.

This integration will bring features such as Quick Insights, Smart Data Discovery, Natural Language querying, AI-Powered Visuals, and Automated Machine Learning to the entire MS ecosystem.

Microsoft is aggressively pursuing the BI market

Microsoft, with its financial strength and expansive platform, will dethrone Tableau.

With Windows on 74% of computers and a strong ecosystem including Excel, Word, PowerPoint, and Teams; Power BI is positioning itself as a key player in Data Analytics.

Final Thoughts

For Tableau users it’s not all bad news, your core skills and theoretical knowledge in data analytics and visualization are completely transferable.

While learning the Power BI interface might be necessary, it can be done quickly. Your foundational knowledge as an Analyst will stay with you throughout your career, and if Power BI ever falters, you can adapt your skills to the next innovation. Being open to change ensures you can’t lose.

For Power BI Courses please visit DataMaxy.